The Positional Shot-Quality Leaderboard: Who Beats Her Own Shot Chart
A zone-based expected-points analysis, position-adjusted, 2024-2026
Introduction
Field-goal percentage answers one question and hides another. It tells you how often a shot went in, not how hard the shot was. A center making 55% at the rim against a league where centers make 64% there is having a worse season than her raw number suggests. A guard hitting 40% from three against a 33% guard-league baseline is having a better one than hers suggests. Neither shows up in a raw percentage sorted across positions that face entirely different shots.
This piece assigns every field-goal attempt an expected value based on where it was taken and what position the shooter plays, then compares actual points to that expectation. Three findings follow.
First, five players clear their positional bar by double digits per 100 attempts across the pooled 2024-26 window, though which of the five sits on top shifts with where the attempt floor is drawn. Second, the bottom of the list is far more extreme than the top, and the reason traces to one player: Angel Reese generates more rim volume than almost anyone in the league and converts it at a rate well below her position’s bar, badly enough to sit below the rest of the league by a wide margin. Third, adjusting for shot difficulty and not just location changes who looks bad: at least one center whose raw number looked poor is taking punishing shots relative to her position, and her adjusted number lands close to average.
Data and methodology
Every field-goal attempt is assigned to one of nine court zones. A shot’s expected value is the average points scored on attempts from that zone by players at the same position group (guard, forward, center) in the same season. Where a zone had fewer than 50 positional attempts, I fell back to the league-wide value instead, 16.7% of zone cells but only 0.25% of all attempts. A player’s overperformance is her actual points minus the sum of those zone expectations, per 100 attempts.
This is a full-shot-diet measure, layups and post shots and putbacks included, unlike the jump-shot-only cuts used elsewhere in this project. The headline leaderboard pools 2024-26 at a 500-attempt floor; a season-by-season file back to 2012, 100-attempt floor, is used for individual-season splits and the historical check below.
Position groups change the answer more than they might look. A’ja Wilson’s overperformance is +15.9 per 100 judged against the whole league; judged only against centers, it drops to +11.9. The positional version is the one used throughout, and it is why several players who look fine league-wide do not look fine here.
Results
Top 5, per 100 attempts vs. positional expectation (min 500 attempts, pooled 2024-26):
| Player | Attempts | Over/100 |
|---|---|---|
| Nneka Ogwumike | 1,459 | +17.3 |
| Paige Bueckers | 959 | +17.1 |
| Leonie Fiebich | 532 | +17.0 |
| Sophie Cunningham | 583 | +15.3 |
| Jessica Shepard | 505 | +14.2 |
Bottom 5:
| Player | Attempts | Over/100 |
|---|---|---|
| Angel Reese | 1,097 | -28.6 |
| Aneesah Morrow | 503 | -18.8 |
| DiJonai Carrington | 703 | -14.8 |
| Brittney Sykes | 903 | -12.6 |
| Elizabeth Williams | 528 | -12.4 |
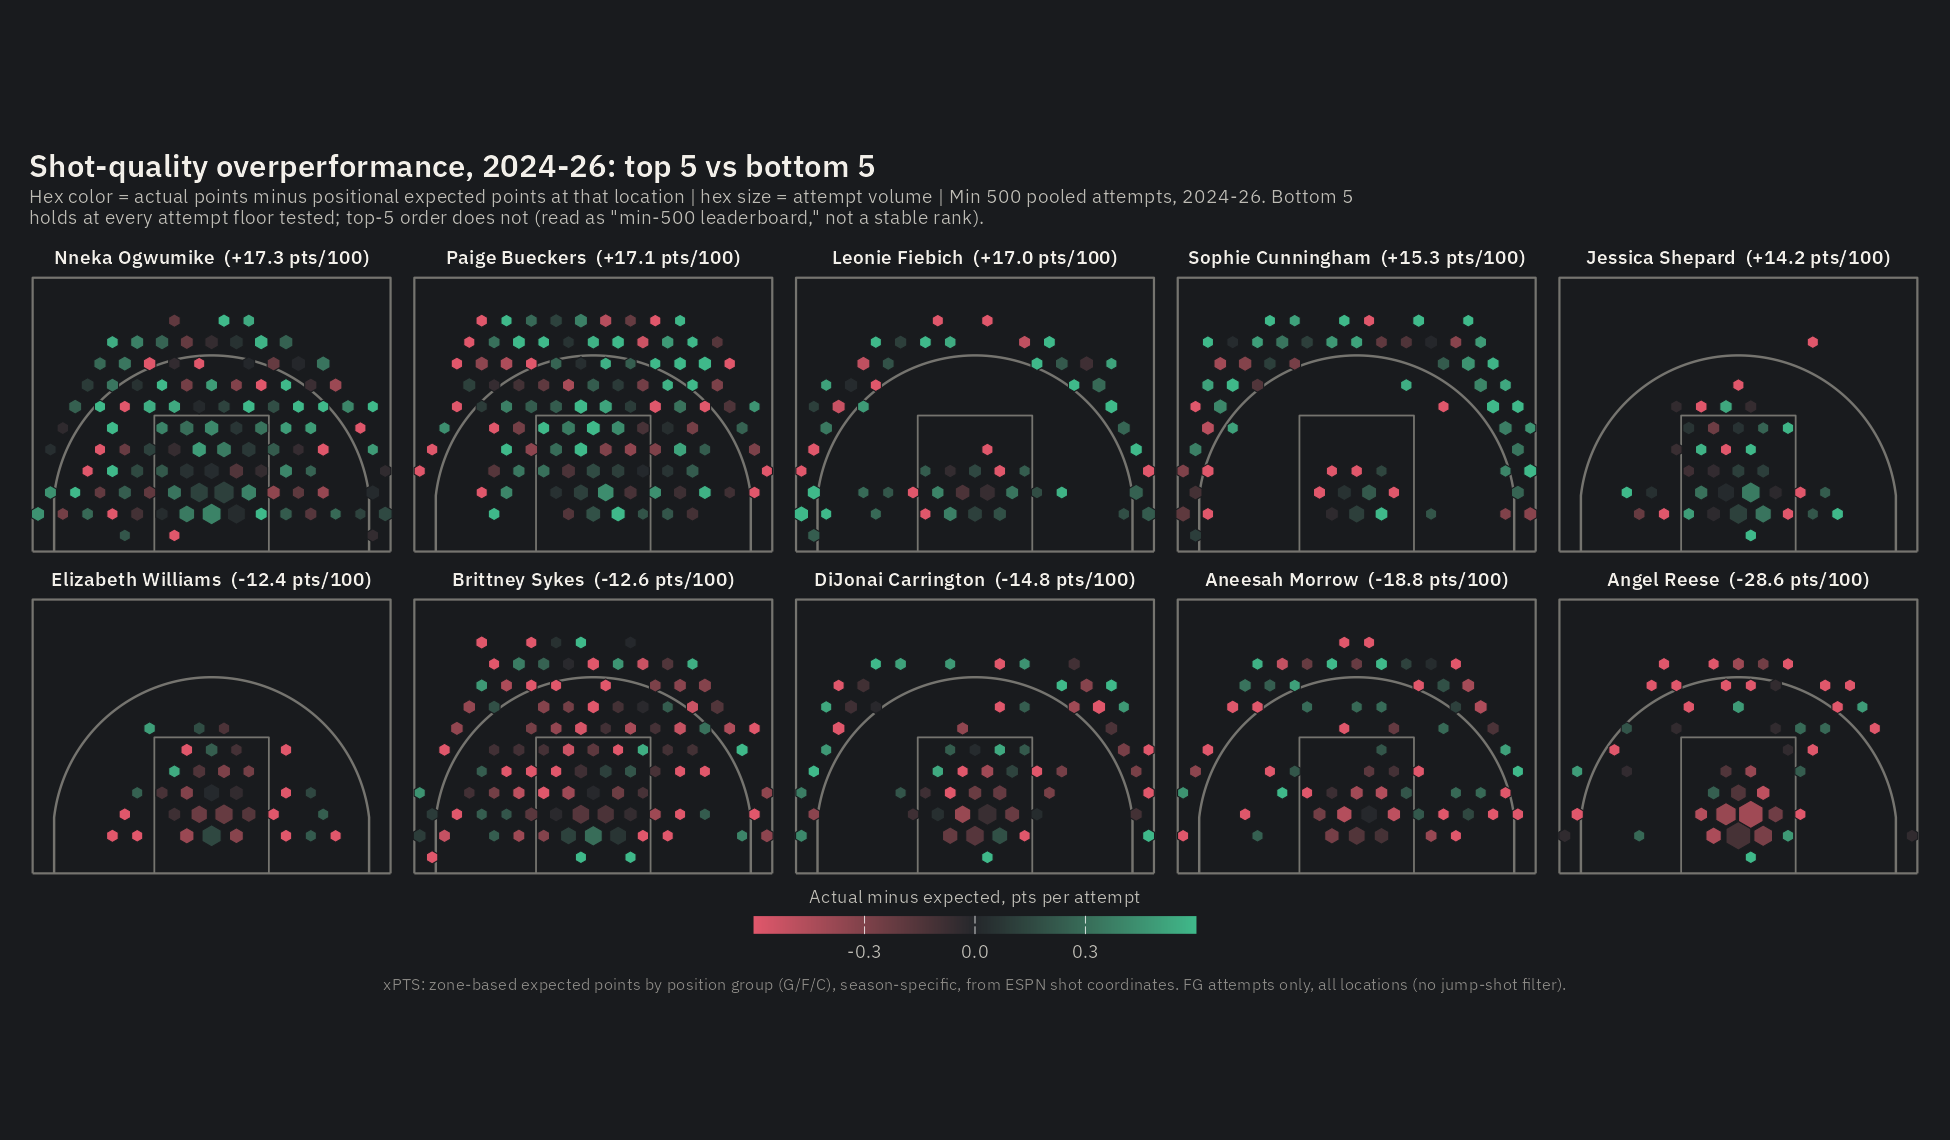
All ten clear the 500-attempt floor. The bottom five is stable: the same names anchor it at a 300 or a 1,200-attempt floor, and Reese finishes last at every cut tested. The top five is not: at 300 attempts, Natasha Mack (+18.0) and Zandalasini (+15.6) enter ahead of most of the names above. Part of that instability is tenure, not noise. Ogwumike, Fiebich, and Cunningham each carry three full seasons in the 2024-26 window; Bueckers has two, having debuted in 2025, not 2024. Read the top five as a group clearing the bar by a wide margin, not a ranked podium.
Bueckers is the top-five case worth watching rather than banking. Her pooled +17.1 is a rookie year and a sophomore year, not a career: +13.7 per 100 on 549 attempts in 2025, +21.6 on 410 in 2026. Catch-and-shoot was already elite as a rookie and stayed there (+23.4, then +26.5); the bigger move is off the dribble, +2.5 in year one to +10.3 in year two. A number built on two seasons, one of them a jump, is exactly the kind of top-five entry likeliest to move again next year, in either direction.
Reese’s number starts with volume, not failure. She generated 745 rim attempts over the qualifying window, the heaviest rim workload of any player in this comparison, and getting there at that rate is itself a real skill: drawing pressure into the paint and getting a shot up close, over and over, more than almost anyone else in the league regardless of position.
What happens once she gets there is the extreme outlier. She shot 49.8% at the rim on those 745 attempts against a 64.1% positional bar, a 14.3-point gap and the worst shortfall of any player with 300-plus rim attempts; the next-worst, Cardoso, is at -6.6. Of her -313 points below expectation overall, 84% comes from inside 8 feet: -213 in the 0-4 foot zone, -52 from 4-8 feet. The obvious alternative, that her rim shots are mostly contested putbacks the model can’t see, does not hold: only 2.1% are tagged tip or putback, below the league average. Unlike Bueckers, the gap is not closing: -31.4, -22.6, -31.2 per 100 across her three seasons, rim accuracy stuck at 48-52% against a 63-65% bar every year.
That volume is also the case for optimism. Cut the FG% gap in half, holding her attempt rate constant, and the added makes are worth on the order of 100 points across the pooled window, more than 50 in a full season at her current pace. She does not need a new shot or a new way of getting to the rim, only to make the ones she already gets to a few points more often.
The xPTS leaderboard, 2024-26: where the stars actually sit
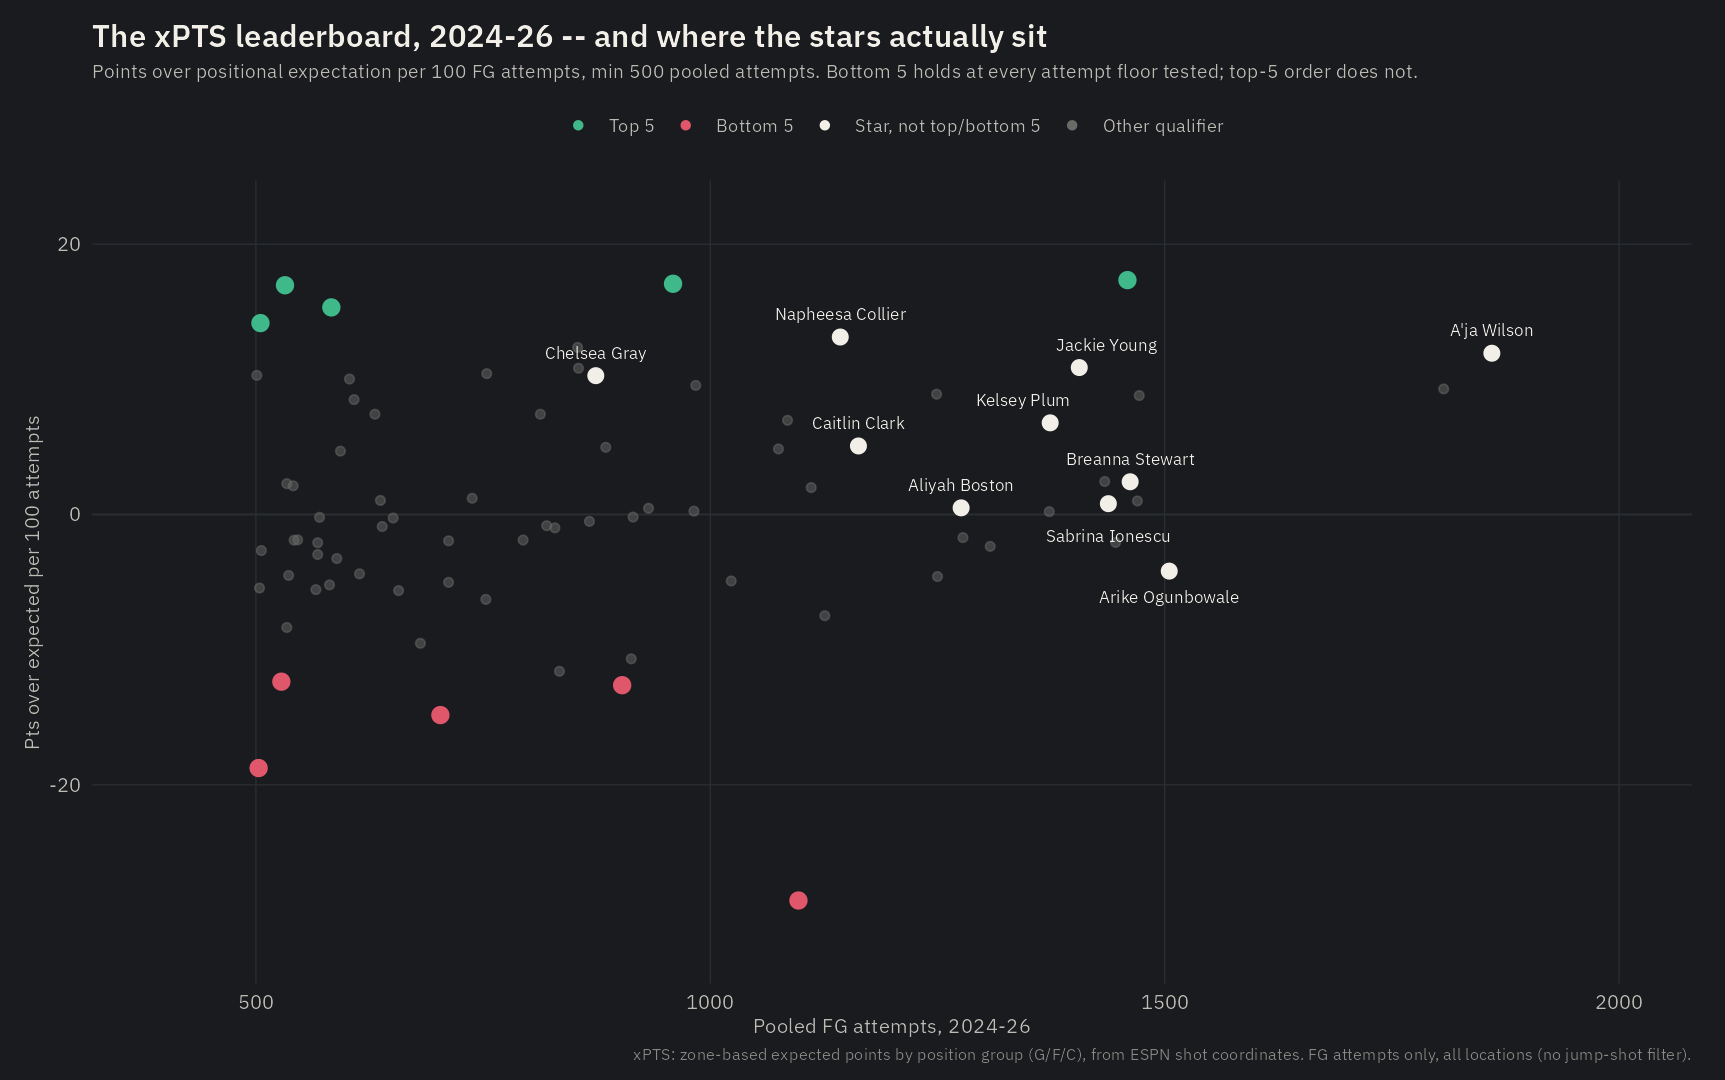
For reference, where the league’s biggest names sit: Wilson +11.9 (1,860 att), Clark +5.1 (1,163, nearly all in one zone), Stewart +2.4 (1,462), Boston +0.5 (1,276), Ogunbowale -4.2 (1,505). None clears the top or bottom five; all sit in the wide, noisy middle.
Cardoso is the case for a second look before publishing a number. Her raw figure, -10.7 on 913 attempts, put her among the league’s worse-looking centers. But the zone model only knows where a shot came from, not how contested it was, and the easiest way to look bad here is to take almost nothing but the easiest shots on the floor. A second control, comparing each player only to others with a similarly easy overall diet, moves Cardoso up roughly 30 places to essentially average, Boston up about 16, and Hamby about 21, and cuts the other way for Courtney Williams, Mabrey, and Ionescu, each dropping a similar margin once their harder diets are credited. Reese barely moves, -28.6 raw to -21.8 adjusted, still worst by a wide distance.
Discussion
The Cardoso result already answers one objection: isn’t this just measuring who gets the easiest shots? Partly, which is why the diet adjustment exists and moves some players 20 and 30 places. But it doesn’t erase the leaderboard: Reese’s diet is among the easiest in the league by volume and she still finishes last, adjusted or not. That the correction changes some stories and confirms others is evidence the model works, not a reason to distrust it.
Sample size is the harder challenge, and Bueckers is the live example: most of the full player list reshuffles under small changes to the attempt floor, closer to noise than signal. But the two ends don’t behave like the middle. The bottom five holds at every threshold tested; the top five, while its order moves, keeps producing the same handful of names clearing a wide margin. Read these as a leaderboard of who is clearly good or bad, not a precise ranking inside either group.
There’s a scheme objection too: maybe this measures a team’s offense, not a player’s shooting. Team averages spread widely, and a system story is tempting when one roster clusters positive. It doesn’t hold up: recomputing each team’s average without the player being tested removes almost all of the pattern. The spread is who is on the roster.
Reese’s case raises one more, specific to her: she’s early in her career and will get better at finishing. Rookies as a group underperform by a modest amount, about 3 points per 100, but the typical player trims barely more than a point of that in year two; most of the improvement visible across a full career arc is which players stick around, not individual development. Reese is three seasons in and hasn’t moved: -31.4, -22.6, -31.2, no trend toward the bar.
Last check, since a metric like this lives or dies on matching what is already known: the best individual seasons in the full 2012-2026 file belong to Quigley twice (2019, 2017), Lawson’s 2012, Ogwumike’s 2016, and Elena Delle Donne’s 2019, the unanimous-MVP, 50/40/90 season. A metric that puts that season near the top of eighteen years of data is measuring something real.
Conclusion
The gap between the top and bottom of a positionally adjusted shot-quality leaderboard is not a story about talent gaps invisible everywhere else; most of the league sits in a wide, unremarkable middle where the number moves with the sample. It is a story about the tails. Five players convert their positions’ hardest shots at a rate raw box scores do not credit, and one player gets all the way to the rim more than almost anyone in the league and still leaves points on the floor once she’s there, badly enough that the fix is arithmetic rather than reinvention.