You Can't Tell a Good Lineup From a Bad One by Watching It Play
A lineup-and-substitution analysis of every WNBA five-player unit, 2013-2026
Introduction
Announcers describe good lineups by their style. They push pace, they get to the rim, they move the ball. The description is doing real work in a broadcast, because it is the only thing about a lineup that is legible in real time, and it is never checked against whether the lineup is any good.
This piece rebuilds every WNBA lineup’s playing time from raw substitution data, 2013 through 2026, and asks whether the way a lineup plays looks different for a great one than for a bad one, separate from whether the shots go in. The results break into three parts.
First, it does not. Sort every lineup in fourteen years by net rating and the style numbers, pace, shot selection, how often they get to the rim, are essentially flat from the worst group to the best; the entire 31-point gap in net rating lives in shooting and defense. Second, continuity is worth real points on its own: the same four Indiana players with three different fifth starters in a single season produced a 21-point swing in net rating, and a near-identical exercise for a 2026 Los Angeles lineup points the same way. Third, two teams that looked from a distance like they were making an obvious coaching mistake, trusting a bad lineup with heavy minutes, were not; their most-used lineups were performing almost exactly at the level of the team around them.
Data and methodology
Each player’s on-court time is rebuilt from her own substitution events and starter flag. Where a play-by-play feed logs no substitution at a quarter break, I infer entry and exit from who is visibly on the floor. A lineup is the five players whose on-court intervals cover a given moment, and only moments where exactly five players verify are used.
The reconstruction checks out. 99.7% of player-games land within one minute of the box score, and five players are confirmed on the floor for 96.7% to 99.6% of team-minutes, depending on season. Lineup-level numbers use a 30-minute floor to be citable; the style comparison below uses a stricter 100-minute floor across 245 lineup-seasons, so the shot-selection numbers themselves are trustworthy and not just the net ratings sitting next to them. 2012 is excluded throughout: it is measured differently in the underlying play-by-play, where undercounted possessions inflate its ratings, and its lineup numbers are not comparable to any other season.
There is no wins column, so team net rating is derived the same way as elsewhere in this project: each player’s on-court and off-court net, weighted by minutes, implies a team value, and the roster median is used.
Results
Every 100-plus-minute lineup-season from 2013 through 2026, sorted into five equal groups by net rating:
| Group | Net | Pace/40 | 3PA rate | Rim rate | Assists per make |
|---|---|---|---|---|---|
| Worst fifth | -10.3 | 74.0 | .259 | .246 | .647 |
| 2nd | +0.3 | 75.0 | .269 | .241 | .649 |
| 3rd | +6.6 | 74.6 | .253 | .264 | .666 |
| 4th | +12.1 | 75.0 | .264 | .259 | .654 |
| Best fifth | +21.2 | 74.4 | .279 | .246 | .671 |
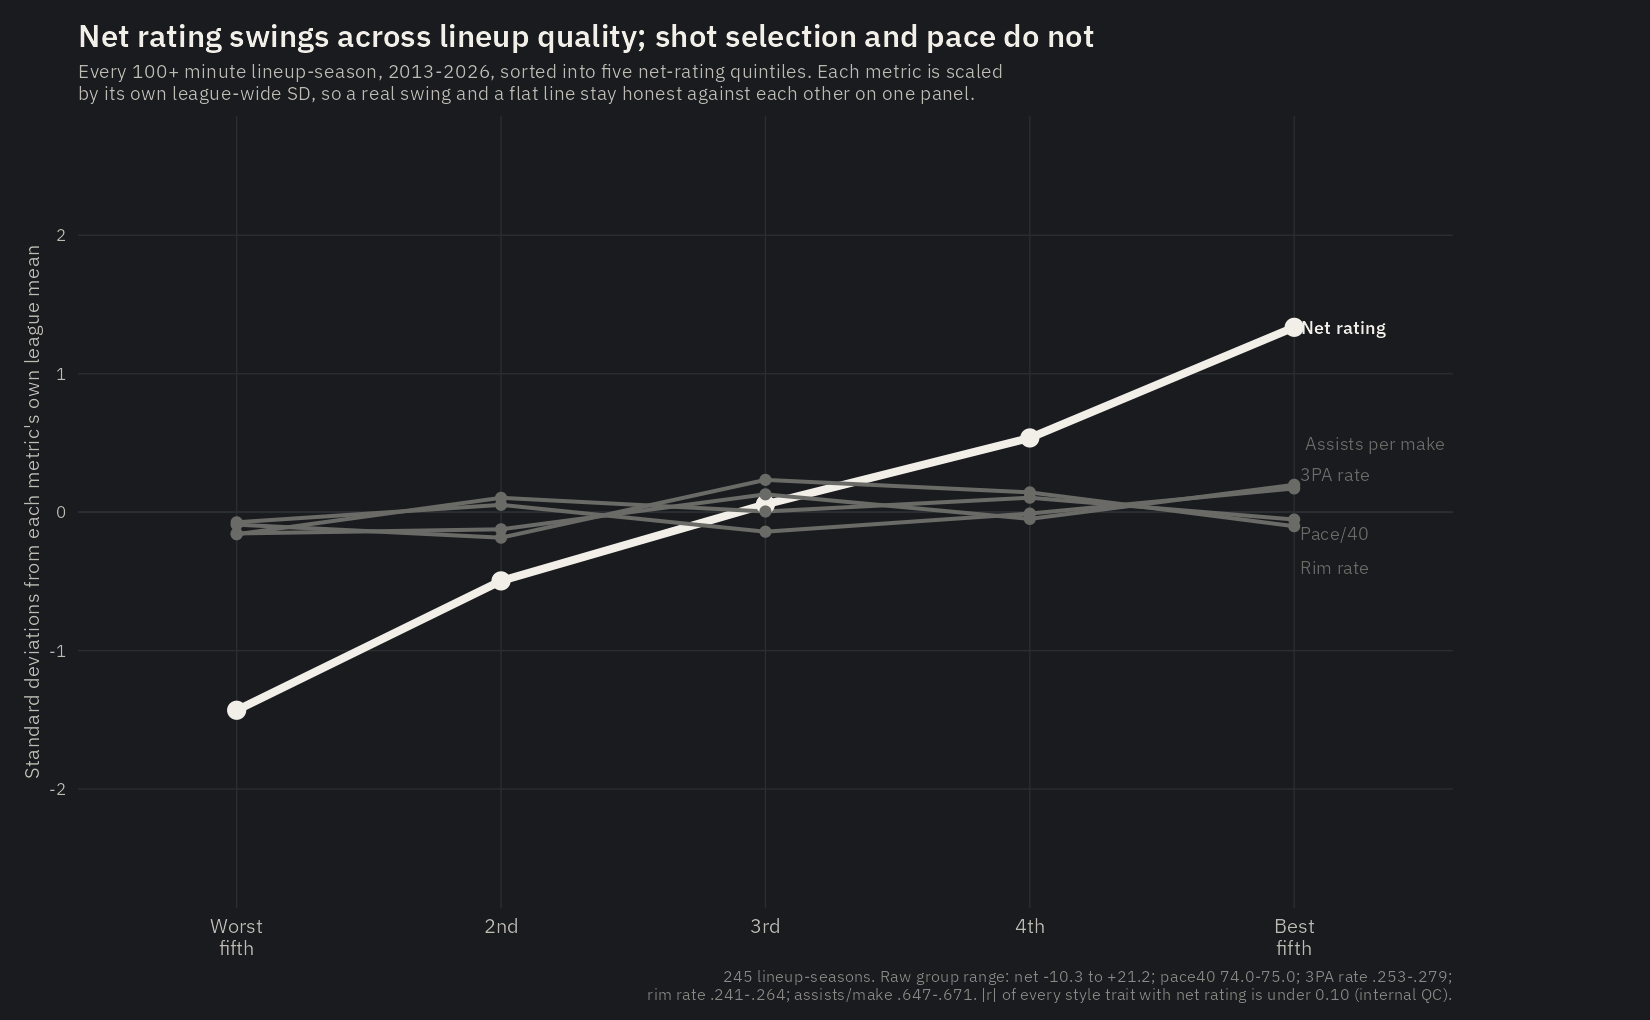
A 31-point swing in net rating, and the best lineups play half a possession per 40 faster than the worst, take two more threes per 100 shots, and get to the rim at literally the same rate, .246 in both groups. Underneath that flat style line, offensive rating runs from 102.6 to 120.7 and defensive rating from 112.9 to 99.5 across the same five groups. Good lineups are not running a different offense. They are running the same one and making it, and stopping the other team from making theirs.
Continuity is a different matter, and it can be isolated in a way most lineup questions cannot. Three separate 2024 Indiana lineups cleared 150 minutes with the identical core of Mitchell, N. Smith, Boston and Clark. Only the fifth player changed.
| Fifth player | Minutes | Net |
|---|---|---|
| Hull | 195 | +6.3 |
| Samuelson | 193 | -6.2 |
| Wallace | 175 | -15.0 |
Nearly equal minutes for all three and a 21-point spread in outcome. This reads as a fifth-starter story rather than a story about any of the four constants; Clark is on the floor for all three.
A similar swap shows up in 2026 Los Angeles. Ogwumike, Wheeler and Hamby appear in all three of the team’s qualifying lineups, and the fourth and fifth spots rotate among Atkins, Burrell and Plum.
| LA lineup | Minutes | Net |
|---|---|---|
| Ogwumike/Wheeler/Hamby/Atkins + Burrell | 233 | -6.2 |
| Ogwumike/Wheeler/Hamby/Atkins + Plum | 82 | +7.0 |
| Ogwumike/Wheeler/Hamby/Burrell + Plum | 62 | +13.2 |
The first two rows are the clean comparison: four players held fixed, Burrell swapped for Plum, and a 13-point move. The third row is not a single-player swap off either of the others and should be read as corroboration rather than as a third point on the same line. Plum played 413 of LA’s 1,082 total minutes, and the two lineups that include her are the team’s only positive ones on record. 82 and 62 minutes is a thin sample; this is a fact about a small window, not a verdict on a season.
Two 2026 teams gave heavy minutes to lineups running well below zero: LA’s most-used five, 233 minutes at -6.2 net, and Portland’s Carleton/Gustafson/Engstler/Barker/Leite, 236 minutes at -7.6. Both look on their face like a coach trusting a losing group. Checked against each team’s own level, neither is. LA’s five was playing at -6.2 on a team that finished at -6.2 overall; Portland’s was at -7.6 on a team at -7.1. Both teams were simply bad, third- and second-worst in the league by this measure, and neither had an obviously better alternative sitting on the bench: LA’s other qualifying fives average -4.4 net, Portland’s average -5.8.
The real minutes-allocation gap in 2026 sat elsewhere. Golden State finished at +6.0 net overall and gave 223 minutes to a most-used five running at -3.7, a 9.7-point gap and the only heavily used lineup on a winning team performing meaningfully below its own team’s level. Phoenix’s most-used five showed a larger gap still, -13.3, but on only 87 minutes.
Continuity itself is not a fading practice. A team’s single most-used lineup typically covers 13 to 18% of its season, about one minute in six, ranging from 8% to 19% depending on team and year, and all 30-plus-minute lineups on a roster together cover roughly 42% of total minutes. The record for a single lineup’s share belongs to 2019 Connecticut, 42.2% of the team’s entire season, 539 of 1,277 minutes on one five-player unit. Two 2026 teams, Minnesota and Atlanta, rank in the all-time top ten for their most-used lineup’s share despite playing only a partial season, and both are among the league’s three best teams this year.
Best five-player lineups on record, minimum 150 minutes together in a season (net rating per 100 possessions, regular season only, from reconstructed stints):
| Team-season | Lineup | Net rating | Minutes |
|---|---|---|---|
| 2014 PHX | D. Taurasi / E. Phillips / C. Dupree / D. Bonner / B. Griner | +39.3 | 159 |
| 2013 MIN | L. Whalen / R. Brunson / J. McCarville / S. Augustus / M. Moore | +32.8 | 315 |
| 2014 PHX | P. Taylor / D. Taurasi / C. Dupree / D. Bonner / B. Griner | +26.7 | 402 |
| 2013 CHI | S. Cash / S. Fowles / E. Prince / C. Vandersloot / E. Delle Donne | +25.5 | 326 |
| 2021 PHX | D. Taurasi / B. Griner / S. Diggins-Smith / B. Turner / K. Nurse | +25.0 | 221 |
| 2018 WSH | L. Sanders / K. Toliver / E. Delle Donne / N. Cloud / A. Atkins | +24.8 | 278 |
| 2023 WSH | E. Delle Donne / N. Cloud / B. Sykes / A. Atkins / S. Austin | +24.5 | 206 |
| 2023 LV | C. Parker / C. Gray / K. Plum / A. Wilson / J. Young | +22.1 | 239 |
| 2018 SEA | S. Bird / A. Clark / N. Howard / J. Loyd / B. Stewart | +21.7 | 522 |
| 2017 MIN | L. Whalen / R. Brunson / S. Augustus / S. Fowles / M. Moore | +21.6 | 314 |
The all-time board is a continuity board. Every group on it logged at least 150 minutes and most logged double that, which is the point: a lineup cannot post a number like this without being kept together long enough to post one at all. The 2014 Phoenix and 2013 Minnesota entries are the same rosters that anchor the top of the team-level net rating list, seen from five players in rather than twelve.
Discussion
The most obvious pushback is that the style table proves only that box-score style stats can’t separate good lineups from bad, and that the real signal is somewhere else entirely. It is somewhere else, and it isn’t invisible: offensive and defensive rating separate the five groups cleanly across a 31-point swing. What doesn’t separate them is shot selection, pace, or ball movement. The gap is entirely in whether the shots go in and whether the other team’s do, not in what kind of shots either lineup chooses to take.
LA and Portland raise a more specific version of the same complaint: doesn’t giving 230-plus minutes to a negative lineup count as a real mistake, whatever the team’s overall level? Not once the comparison is to the team’s own level rather than to zero. A -6 lineup on a -6 team is baseline performance for that roster, not a coaching failure, and neither team had a clearly better five waiting in reserve. Golden State is what an actual mistake looks like by the same standard.
A fair complaint about the Indiana and Los Angeles fifth-player tables is that three or four lineups isn’t a season. That’s true for either table alone, and the LA sample in particular runs to 82 and 62 minutes on the rows that matter. What makes them worth reporting together is that both hold the rest of the lineup fixed, so the swing in outcome can’t be attributed to anything except the player who changed. That’s the closest this kind of data gets to isolating a single swap.
Indiana’s numbers invite a Clark-specific question: doesn’t a lineup analysis eventually have to say something uncomfortable about her, given how much attention her team’s shot-making draws? It says less than the discourse assumes. Indiana’s most-used five in 2026, which includes Clark, ran +2.8 net over 178 minutes. The team’s on-off split without her looks worse on its face, but a large share of that gap traces to four games she missed entirely against three of the league’s four worst teams by this measure, a run of favorable scheduling rather than anything happening on the floor. In the minutes she actually played, the gap between her team’s performance with and without her shrinks to something no larger than ordinary game-to-game noise.
Conclusion
The lineups that win are not running a visibly different style of basketball than the lineups that lose. They are taking the same shots from the same places at the same pace and making more of them. What that leaves is a strange situation for anyone watching a game: the part of a lineup that is legible in real time, the part broadcasts are built around describing, is the part carrying none of the information. The part that decides games is the one nobody can see until the shots have already gone up.