Ball Movement Doesn't Win Games. Ball Concentration Does.
A passer-to-scorer network analysis of every WNBA offense, 2013-2026
Introduction
“They share it” is one of the most common compliments in basketball broadcasting and one of the least tested. It describes something real that is visible from the stands, extra passes and open catch-and-shoot threes, and it carries an implied claim about outcomes that nobody checks.
This piece builds a passing network for every WNBA team-season since 2013, every assisted basket mapped as an edge from passer to scorer, and asks a direct question: do teams whose offense runs through fewer hands win more, or less?
Three findings follow. First, the answer runs opposite to the compliment. Team-seasons where the offense concentrates in fewer hands win more, and the gap between the most concentrated quarter of the league and the least is 8.6 points of net rating, one of the larger relationships in this project. Second, this is not a system a coaching staff installs. Which player an offense runs through turns over constantly, so concentration behaves like a roster fact rather than a philosophy. Third, the standard way of describing an individual player’s role, her share of her team’s total passing involvement, is less useful than a simpler ratio of how much she creates against how much she finishes, which turns out to be one of the most repeatable descriptors of any player anywhere in this project and recovers a real career transformation without being told to look for one.
Data and methodology
Every assisted field goal is an edge from the passer to the scorer. A player’s flow share is her fraction of her team’s total assist involvement, thrown and finished combined, in a season; shares sum to 1 per team. Team concentration is the sum of those squared shares, a single number that rises as the offense runs through fewer hands. Its reciprocal is the more legible version: the number of players a team is effectively running its offense through. A concentration score of .158 means roughly six; .091 means roughly eleven.
Assister identities are verified against parsed play-by-play text at a 99.6% match rate. I excluded any team-season under 200 total assists, which operationally drops All-Star exhibition squads along with it, leaving 172 team-seasons. No WNBA version of this analysis exists in public work; the network method itself is established in the NBA.
There is no wins column anywhere in this data, so team net rating is reconstructed: each player’s on-court and off-court net ratings, weighted by her on and off minutes, imply a team value, and the roster median is used as that team-season’s net rating. This is a proxy, and it checks out. The top five team-seasons by this measure are 2014 Phoenix, 2017 Minnesota, 2019 Washington and 2020 Seattle, all of them champions, plus 2023 New York, a finalist. The bottom includes 2020 New York and Indiana’s rebuilding years. The league-wide average sits within a quarter point of zero in every season, which is what a proxy for net rating should do.
Results
Las Vegas ran the league’s most concentrated offense in 2026, .158, with Jackie Young at a 22.1% flow share inside a Young-Gray-Wilson core. Connecticut ran the least concentrated, .091, with Charlisse Leger-Walker the team’s top connector at just 12.2%. Those two numbers are the practical range of the entire league: six hands against eleven. The single highest individual share belonged to Alyssa Thomas, 26.9% of Phoenix’s entire assist involvement. Caitlin Clark ran 21.2% of Indiana’s flow, the league’s sixth-most-concentrated offense.
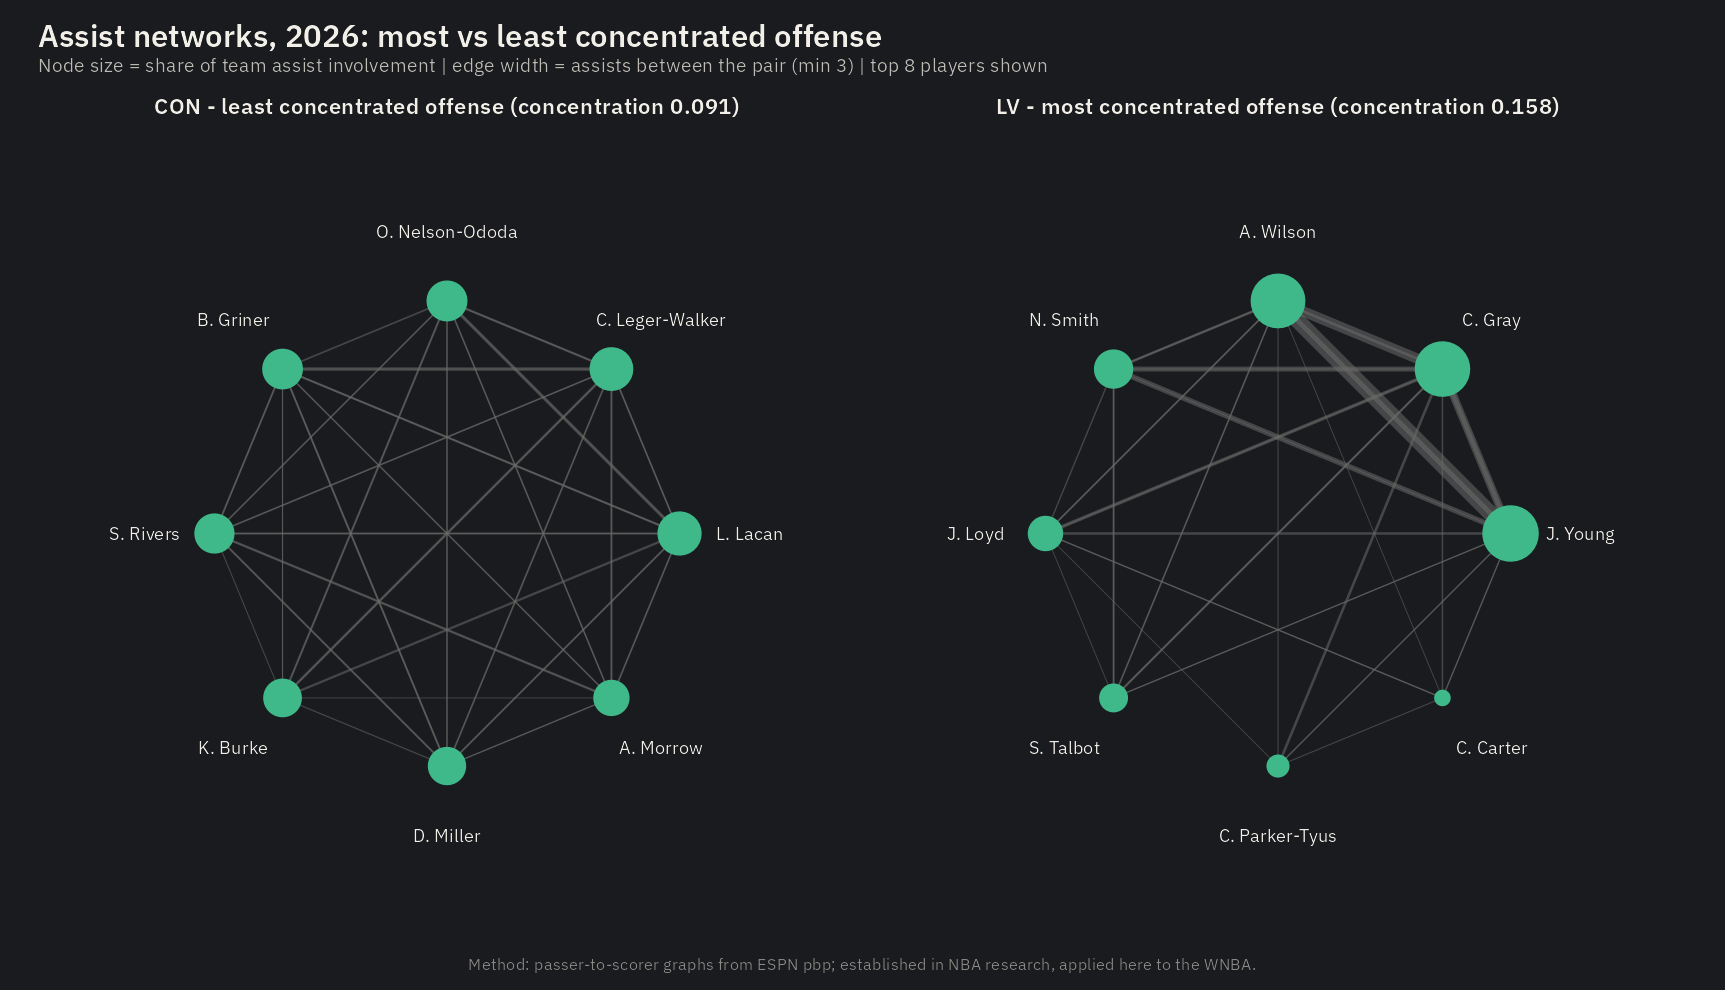
The two panels are the same eight-player picture drawn twice. Connecticut’s nodes are close to interchangeable in size and its edges close to uniform in weight, which is what an offense running through eleven effective hands looks like. Las Vegas has three nodes carrying most of the volume and a Young-Gray-Wilson triangle heavy enough to read as the offense itself.
Sorted by concentration across all 172 team-seasons, the two ends do not perform alike.
| Concentration quartile | Average net rating |
|---|---|
| Bottom quarter (most spread out) | -4.5 |
| Top quarter (most concentrated) | +4.1 |
That gap survives the obvious alternative explanations. It is not simply teams with fewer rotation players concentrating the ball by default, and it is not simply a byproduct of having more individual talent on the roster. It also shows up within a single franchise over time: when a team’s own concentration level moves from one season to the next, its net rating moves with it. Splitting the network into its two halves, concentration of who throws the ball against concentration of who finishes it, the finishing side carries more of the relationship, but both hold up on their own after accounting for talent and rotation size. None of this fixes the causal direction, and this piece does not claim one. The honest reading is that a concentrated offense is not the symptom of a thin roster it looks like on its face; teams with comparable personnel still perform better when the ball runs through fewer hands.
The shape of a network, unlike almost everything else about a WNBA offense, is a league constant. Concentration shows no drift at all across fourteen seasons, while three-point attempt rate went from .217 to .369 of all shots and assists per made field goal rose from .569 to .661. The number of players a team effectively runs its offense through sits at a median of 8.3 and has never left a band of roughly six to eleven. The three-point revolution changed what WNBA offenses shoot and how often they pass. It did not change how many hands the ball moves through to get there.
It is not a stable team property either. The player who is a team’s top connector one season is the same player the following season only about a third of the time. Whatever makes an offense concentrated arrives and leaves with personnel.
The panel separately tracks how much of a player’s involvement was given, an assist she threw, against received, a basket she finished off someone else’s pass. The ratio of the two, given divided by given-plus-received, is her hub ratio: 1 for a pure creator, 0 for a pure finisher. It behaves very differently from flow share. It holds up far better from one year to the next, it survives a player changing teams, and it does so inside every position group rather than only among guards. It is one of the most repeatable individual descriptors anywhere in this project.
Career leaderboards, minimum 600 assist involvements across four or more seasons, n=110:
| Role | Top 5 by hub ratio |
|---|---|
| Creators | Canada .844, L. Allen .815, Vandersloot .800, Allemand .797, Cloud .793 |
| Finishers | Fowles .216, N. Smith .247, McCowan .248, Lavender .257, Griner .266 |
| Two-way (hub .40-.60, ranked by flow share) | Moore .198, McCoughtry .179, Ogunbowale .173, Mitchell .173, Boston .173 |
The clearest evidence the ratio is measuring something real is Alyssa Thomas. Her career hub ratio moved from .470 across her first three seasons to .747 across her last three, the largest shift in the entire panel by a wide margin. Nobody told the metric that Thomas converted from scorer to point-forward partway through her career. It found the conversion using nothing but assists thrown and received.
One limit, stated plainly: the ratio describes who a player already is, not what a new role will let her become. For players who changed teams, knowing a prior hub ratio does not meaningfully improve a guess at what the new team’s offense will let her do. It is an identity axis, reliable and specific, and not a forecasting tool.
Discussion
The obvious objection is the eye test itself: doesn’t ball movement look, from the stands, like good offense? The data says the compliment describes a style, not an outcome. Concentrated offenses win more even after setting aside how many players a team actually uses in its rotation and how much individual talent sits on the roster. Two teams with similar personnel still perform better, on average, running through fewer hands.
A related challenge is that this is really one dominant scorer carrying a bad team rather than a system worth valuing. The finishing side of the network does carry more of the relationship than the throwing side, so the objection has something behind it. But the throwing side holds up on its own, and a single-dominant-scorer story would not predict that concentration moves with net rating inside the same franchise as its roster changes year to year.
There’s also a coaching-philosophy reading of this, something a staff installs and sticks with. It doesn’t hold up. The player a team runs its offense through changes in roughly two years out of three. Concentration travels with personnel, not with a system, which means the finding is closer to a roster-construction result than a tactical one.
Point guards get their own version of this: the modern guard’s hub ratio trends down across the league, so are point guards passing less than they used to? Not any individual one. The guard population itself changed, growing from under half of all qualifying guards a decade ago to over half today, with the added players skewing toward secondary ball-handlers who never had a high hub ratio to begin with. Track the same players over time and their creator-finisher balance does not move. The league looks different because who is in it changed, not because anyone’s game did.
Conclusion
A concentrated offense outperforms a spread one by 8.6 points of net rating at the extremes, the identity of who concentrates it turns over with the roster, and the best available description of a player’s role is not how much of the ball she touches but the ratio of what she creates to what she finishes, an axis stable enough to catch a career-defining positional shift without being pointed at it. None of that requires crediting or blaming a coaching staff for a team’s shot distribution. The compliment broadcasters reach for describes what an offense looks like. It does not describe which one is working.